Acquire assistance to avoid the common pitfalls when visualizing your metrics
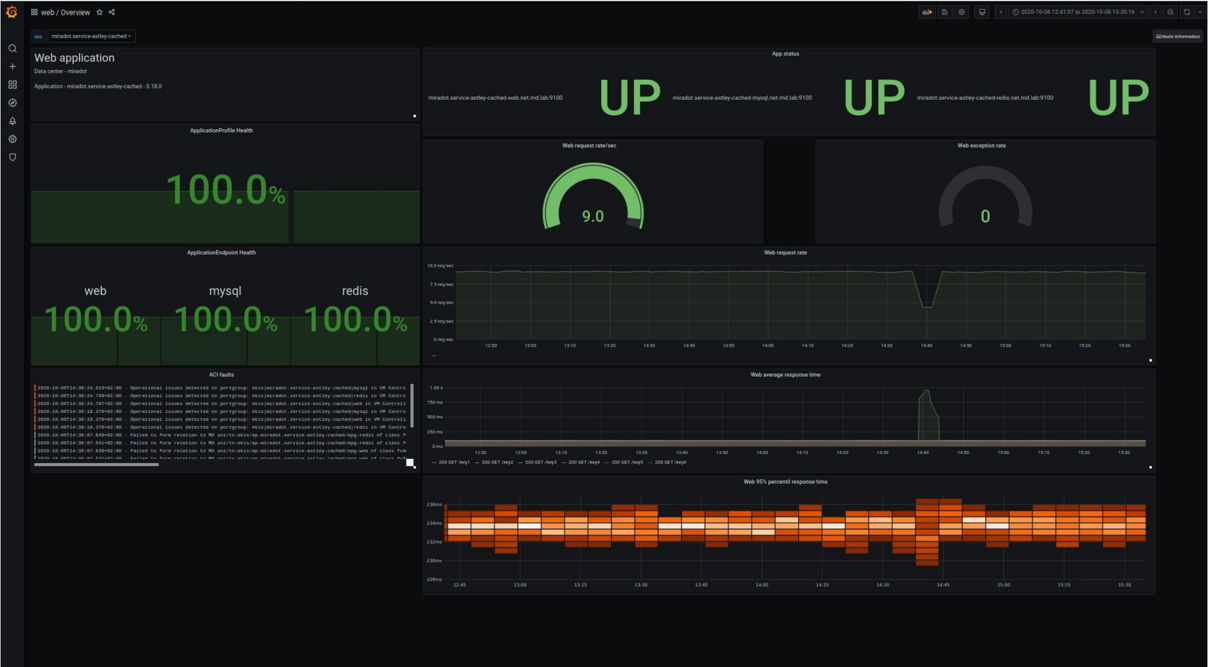
Prometheus and Loki in combination with Grafana has become the go-to tools for monitoring and visualizing metrics in dynamic environments, both in cloud and on premises.
With our experience of using Prometheus and Grafana in many customer projects, both as stand alone monitoring solutions and as integrated with other monitoring systems, we can provide
- A combined solution of metrics and log/event data using Grafana for visualisation and root cause analysis.
- Development of Prometheus exporters, check out our GitHub for examples
- Modeling of metrics and label naming to give the best insight to your metrics data
- Alert and notification solutions
- Design of Prometheus and Grafana automated installation with dynamically created dashboards and target discovery
- HA solutions and long term metrics storage
- Workshop to get you started
Flexibility in our delivery
Tell us your needs and we will be happy to advise.
FAQ

Can you assist in combining metrics from our different systems and applications to build a dynamic custom dashboard?
Yes, we have carried out similar deliveries many times and you will be up and running within a week.
What do you primarily help your customers with?
We design monitoring solutions for our customers. This typical involves analyzing metric and log capacity requirements, integration with applications and infrastructure, but also other monitoring and logging tools, metric modeling, development of exporters and designing dashboards.
Is it possible to combine Prometheus and Nagios?
That is possible, we recently posted a customer case about it, read it here!
Can you assist with best practices regarding design of our environment?
Yes, an elaborate design enables stability, scalability and paves the way for a successful observability development.