

Martin Säfdal – Senior Consultant
Deep knowledge in Icinga, OP5 Monitor and the Elastic stack. Strong background in Windows, Linux, virtualization and storage. Martin is also an experienced Automation engineer with focus on Ansible.
Welcome to the third part of a mini blog post series that will show how you can use Prometheus together with Icinga 2.
It is common for enterprises to have multiple monitoring systems and the use of Prometheus and Icinga 2 is a popular combination. That is why we want to highlight Prometheus and Icinga 2. The popularity of Prometheus can in some degree be explained by the fact that some packaged Kubernetes solutions use Prometheus as their native monitoring solution, for example OpenShift from Red Hat.
However, Prometheus and Icinga 2 should not be viewed as an “either-or” proposition as these tools complement each other. When used together, it is possible to leverage both of their strengths.
The focus of this post is how to use metrics stored in Prometheus together with Grafana and how to embed graphs in Icinga Web 2. Check out the previous post on how to export metrics from Icinga 2 to Prometheus.
Install Grafana or use an existing Grafana instance.
Edit grafana.ini to allow embedding and enable anonymous access.
[...]

#################################### Security ####################################
[security]
# set to true if you want to allow browsers to render Grafana in a \<frame\>, \<iframe\>, \<embed\> or \<object\>. default is false.
allow_embedding = true

[...]

#################################### Anonymous Auth ######################
[auth.anonymous]
# enable anonymous access
enabled = true

# specify organization name that should be used for unauthenticated users
org_name = Main Org.

# specify role for unauthenticated users
org_role = Viewer

[...]
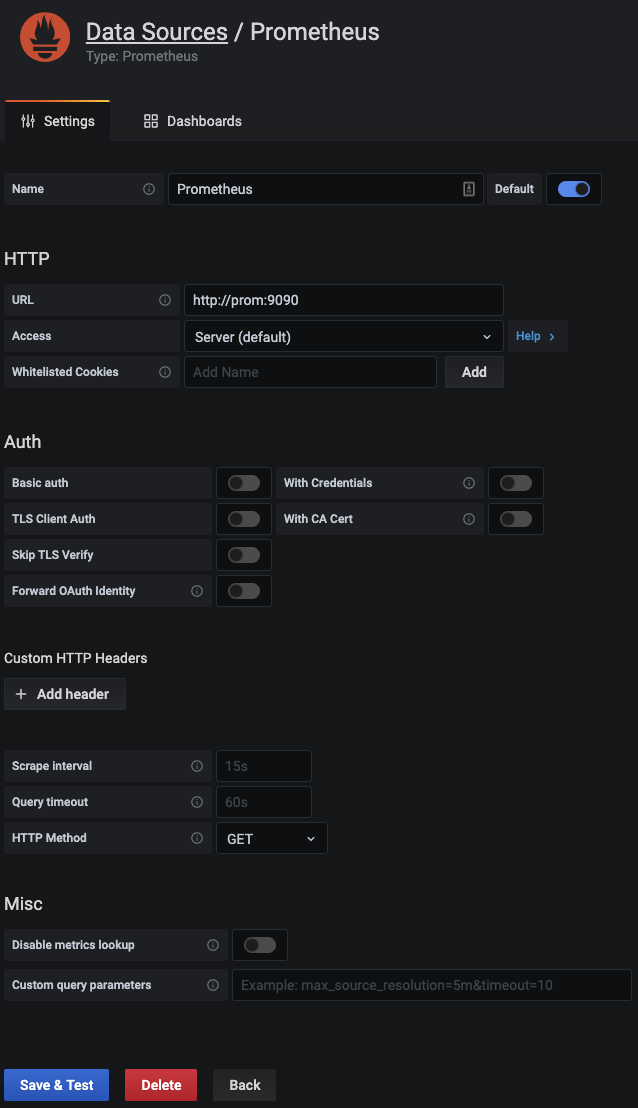
Add a new Prometheus data source in Grafana.
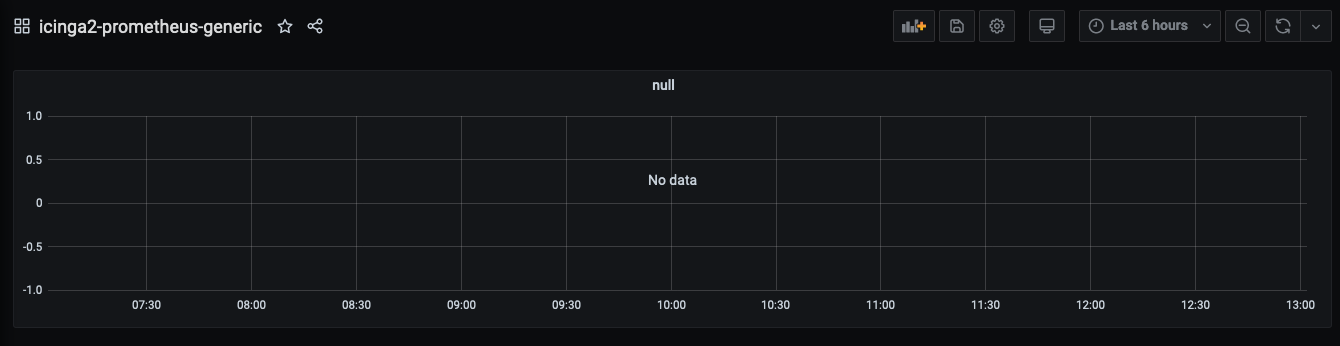
Import the two example dashboards: icinga2-prometheus-generic and icinga2-prometheus-specific provided by Opsdis.
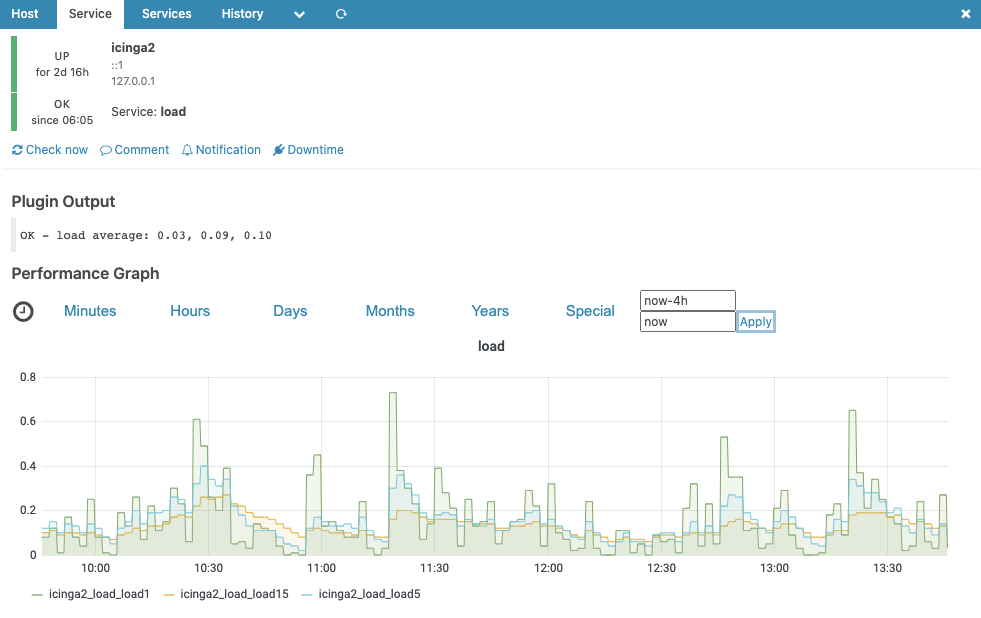
The graph on the generic dashboard uses host- and service name variables to get the metrics from Prometheus. The generic graph will work for all metrics without further configuration but with the drawback that the unit is set to “short” which is not desired in all cases.

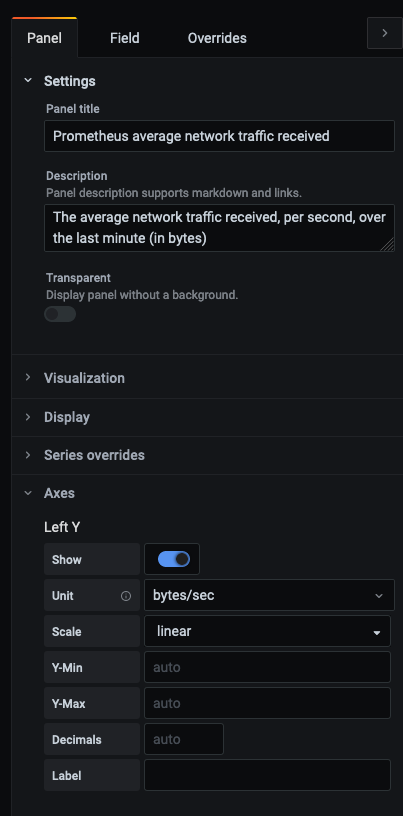
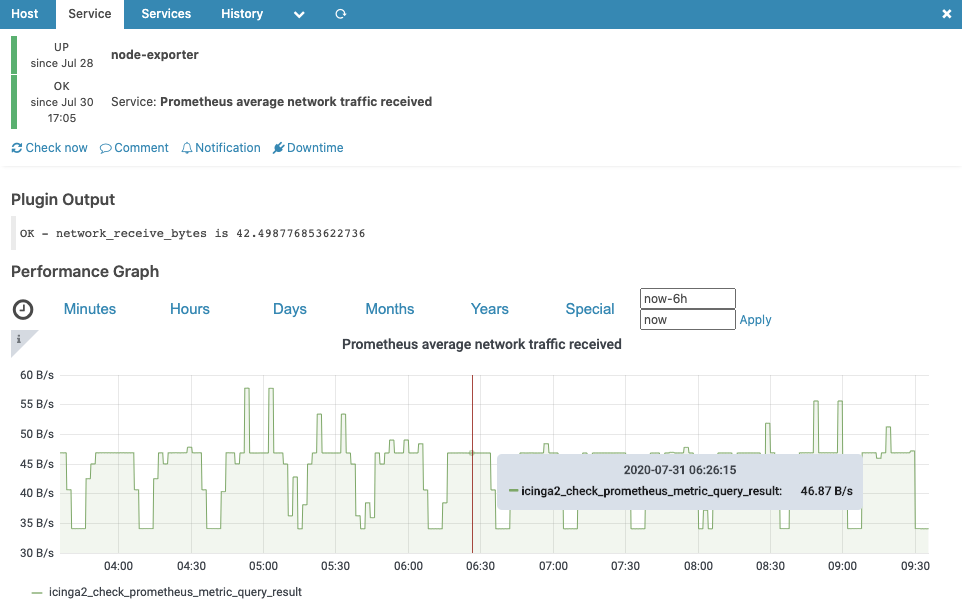
By creating specific graphs for specific services it’s possible to change unit and other parameters. I.e. you can chose percent, Bytes, Bytes/sec or other units based on the format of your metrics.
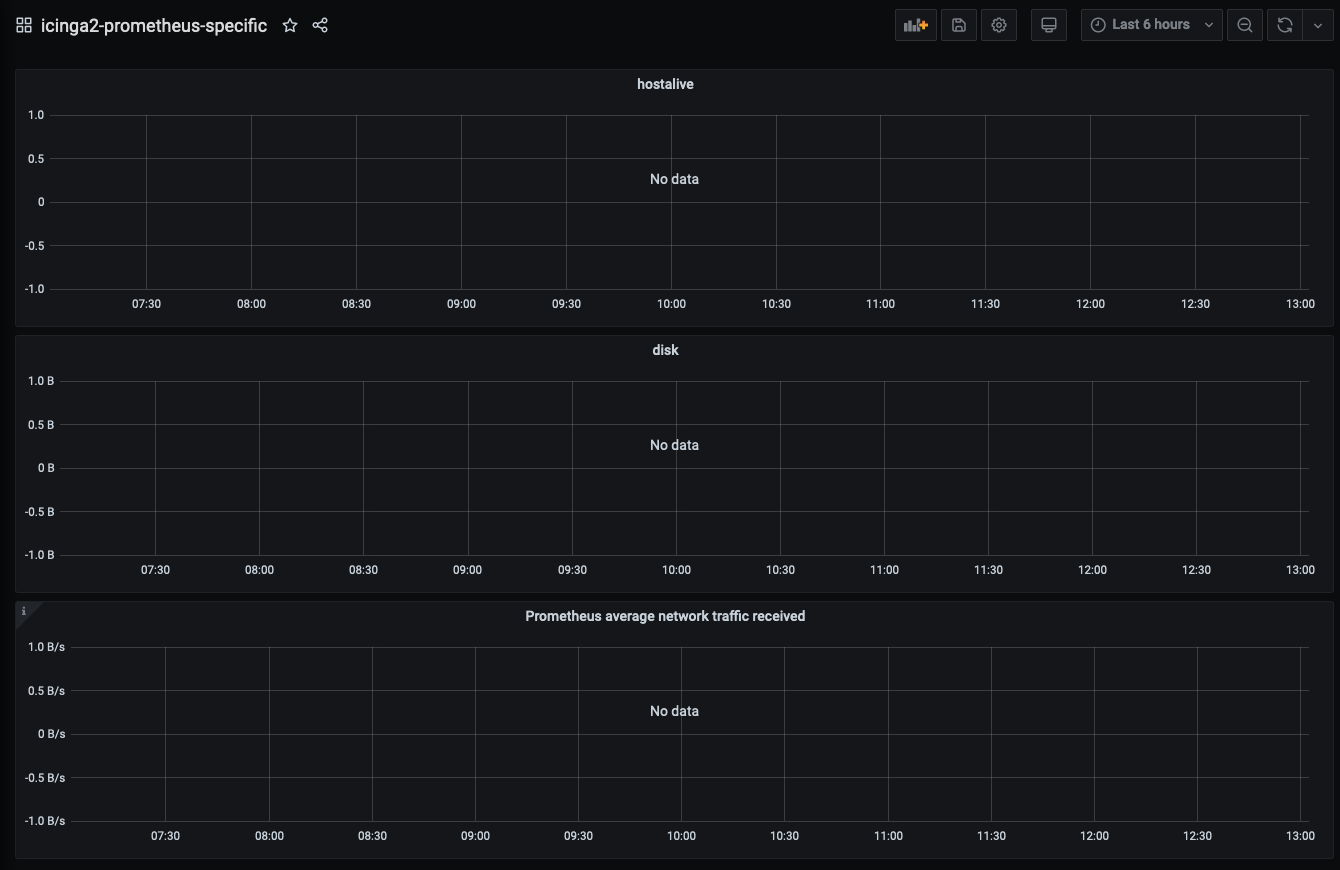
Example bytes/sec
Install the Icinga Web 2 Grafana module.
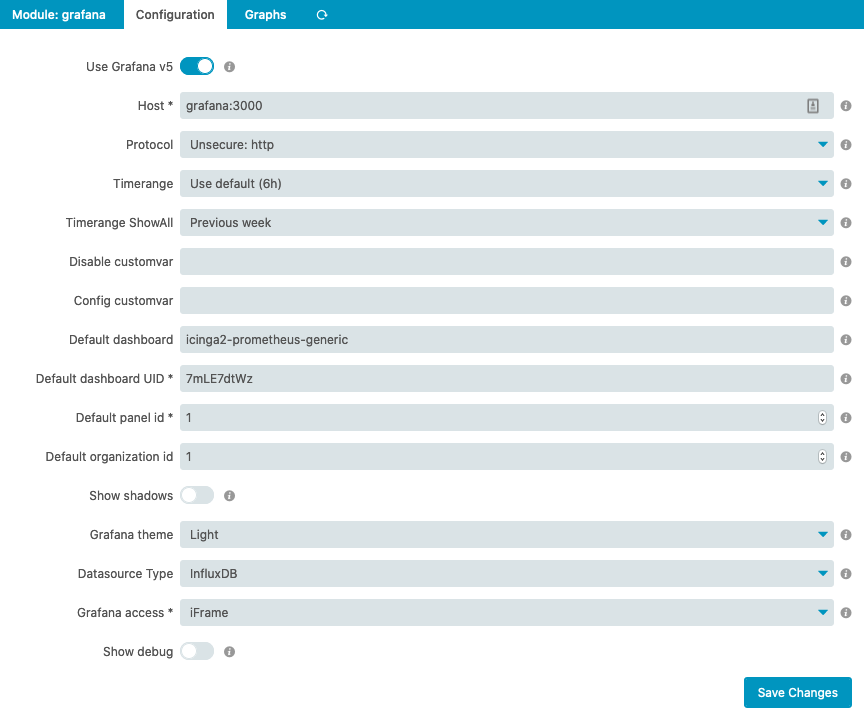
Configure the module by editing /etc/icingaweb2/modules/grafana/config.ini or in Icinga Web 2 under Configuration > Modules > grafana.
Use the generic dashboard as the default dashboard.
[grafana]
version = "1"
host = "grafana:3000"
protocol = "http"
timerangeAll = "1w/w"
defaultdashboard = "icinga2-prometheus-generic"
defaultdashboarduid = "7mLE7dtWz"
defaultdashboardpanelid = "1"
defaultorgid = "1"
shadows = "0"
theme = "light"
datasource = "influxdb"
accessmode = "iframe"
debug = "0"
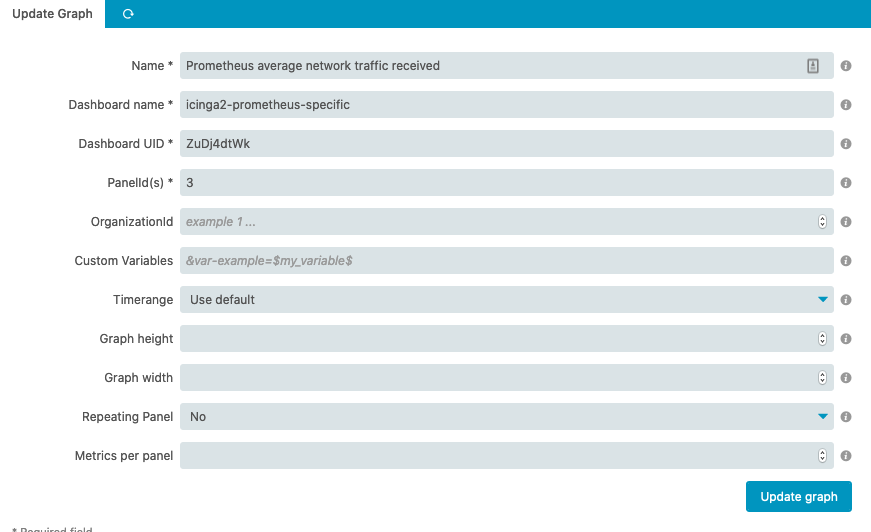
Add a specific graph to /etc/icingaweb2/modules/grafana/graphs.ini or in Icinga Web 2 under Configuration > Modules > grafana > Graphs.
[Prometheus average network traffic received]
dashboard = "icinga2-prometheus-specific"
panelId = "3"
orgId = ""
repeatable = "no"
dashboarduid = "ZuDj4dtWk"
Generic graph
Specific graph with defined unit
Should you need any assistance setting up Prometheus, Grafana or Icinga 2, please contact us to know more.
Follow us on LinkedIn and github.

Martin Säfdal – Senior Consultant
Deep knowledge in Icinga, OP5 Monitor and the Elastic stack. Strong background in Windows, Linux, virtualization and storage. Martin is also an experienced Automation engineer with focus on Ansible.