

Are you running a classic IT environment with virtual servers, network equipment, applications and such and have started to deploy containerized applications in a Kubernetes environment?
Most likely your existing monitoring system is not designed for the dynamic environment that containers provide and your new shining Kubernetes environment comes with Prometheus by default so now you’re managing two monitoring systems.
If you are interested in how you can make them both work together, read about how we helped one of our clients integrate the Nagios/Naemon based ITRS OP5 Monitor with Prometheus to maintain a central monitoring and alerting function.
Challenge
As many organizations today this client has requirements for deploying applications on docker and have successfully implemented the Kubernetes based platform OpenShift from RedHat / IBM.
To monitor OpenShift you typically use Prometheus for scraping and storing metrics in combination with Grafana for visualization and Alert Manager for, well, sending alerts.
Due to the nature of Prometheus, relevant metrics are automatically discovered and scraped as your OpenShift / Kubernetes environment changes and evolves.
Compared to a Nagios based monitoring solution such as ITRS OP5 Monitor, that works with a static model with hosts and services, it’s not straightforward how to get them working together.
Solution
Since ITRS OP5 Monitor is used as the central monitoring and alerting tool we needed to translate the time series data and labels from Prometheus into something that Monitor understands, i.e. hosts and services.
In OpenShift you can deploy as many Prometheus instances as you like and for this case, we have one instance per Kubernetes cluster. We therefore decided to map each Prometheus instance, i.e. Kubernetes cluster, to individual hosts in Monitor with alerts configured in Alertmanager created as separate services on those hosts. That builds an easy to understand configuration of one host per Kubernetes cluster with multiple services depending on what’s configured as alerts for that specific cluster.
We use Opsdis Mender to automatically discover alerts configuration, compare with the configuration of hosts and services in Monitor and make sure they are in sync. If alerts are added or deleted, Mender will update the corresponding host and service configuration mapping matching Prometheus instance and configured alert.
Mender is called periodically from cron or triggered to run by a call to a webhook whenever changes occur.
Now when we have a configuration mapping between Prometheus alerts and Monitor we need a way to get the alert data into OP5 Monitor.
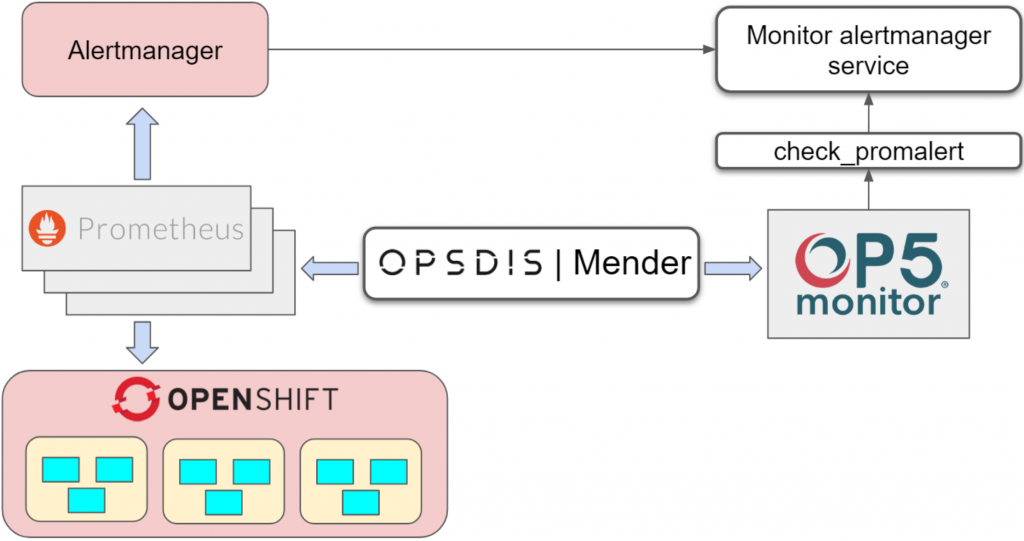
Alertmanager is configured to send alerts to a service called “monitor_alertmanager_service” that keeps track of ongoing alerts.
We then use “check_promalert” which is a Nagios compatible plugin that connects to monitor_alermanager_service and checks for existing alerts. Easy and effective.
With this solution in place, ITRS OP5 Monitor can be used as the central monitoring and alerting system alongside Prometheus and Grafana keeping the strengths and benefits from both systems.