

Scraping metrics out of ACI has been covered in two previous blog posts (see those by clicking here or here). Our open source project aci-exporter Cisco ACI to expose metrics to Prometheus. The aci-exporter can query any classes in Cisco ACI for metrics using a simple query configuration. The configuration includes support for defining metrics value fields, transforming values of metrics and extracting labels using regular expressions. The output format supports both the native Prometheus and OpenMetrics exposition formats.
In this post, we will look into our newly released project called aci-streamer. The aci-streamer is a complement to the aci-exporter by supporting streaming of events from Cisco ACI. Events in this context include any type of change that can occur in an ACI class. So this could include faults, and fault objects which exist in almost all other classes like nodes, tenants, endpoints, nodes, etc. This can also include events like an ACI user session being created, modified or deleted. So the possibilities are almost endless. The trick is, like with aci-export, to know what is important to observe.
Checkout the aci-streamer project for more information about how to configure your streams. In the logger directory, you can find some basic configurations for both promtail (Loki) and filebeat (Elastic-compatible log systems).
Why?
The current trend in the observability space is to enable correlation of information from different sources of metrics, logs/events and traces. If we have a problem with a specific node in our ACI fabric we’d like to be able to “search” for that specific node identifier in all our data sources to get as much valid information as possible. In Prometheus, searches centered on using labels, and the same pattern is applicable to most logging systems. Loki is a logging system developed by GrafanaLabs and heavily inspired by Prometheus. Labels are essential to search through logs. So, if the same labels are used for aci-exporter and for aci-streamer, or any other metrics, a high correlation of the data sources is achieved.
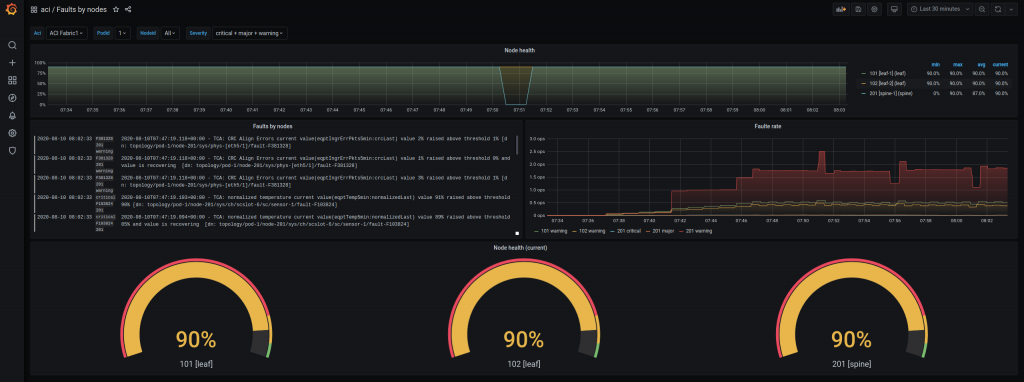
In the above screenshot, we have combined Prometheus and Loki data sources in the same dashboard. In the middle row, we have the Loki logs based on a “stream” form aci-streamer called faults. We have the log panel for Loki logs in the left graph. The query is based on the upper left Grafana variable filters that are applied to the whole dashboard.
{fabric=~"$Aci",stream="faults",podid=~"$Podid",nodeid=~"$Nodeid",severity=~"$Severity"}
On the right graph, we’ve created a simple fault rate metric based on the log data.
sum by (nodeid,severity) (rate({stream="faults",fabric=~"$Aci",podid=~"$Podid",nodeid=~"$Nodeid",severity=~"$Severity"}[5m]))
The rest of the graphs are based on the aci-exporter Prometheus data using the same label filters so we can drill down both on pod, node and severity.
With aci-exporter and aci-streamer we can get a large amount of data for our observability just using the ACI APIC API, without needing any SNMP queries or syslog integration. These can, of course, be valuable additions depending on your use case. But using a single API interface with related user authorization have further benefits as far as minimizing complexity.
We’d love to hear from you and get your feedback. If you have additional needs related any kind of observability engineering or development please contact us at info@opsdis.com.
Don’t to forget to follow us on LinkedIn and Github to get the latest news and links to blog posts at www.opsdis.com.
Author