

Anders Håål – CTO and Founder
A couple a weeks ago we released the Prometheus aci-exporter repository on github . The exporter supports a flexible way to define metrics from class based ACI queries so its easy to extend it to whatever that can be of importance for your environment and ACI setup. The queries are just done in configuration.
Because this is the main question – what metrics and alerts are important to gather from an ACI fabric?
ACI has its own concept of health score. The health score is applied on many different objects in the ACI model. Higher level objects scores depend on the score of objects that higher level depend on. So the overall system and pod health score is calculated from the score of the leaf and spines. A tenant health score is calculated from the health of the logical objects that belong to the tenant like endpoints.
You can find more about ACI health score in this publication from Cisco.
Configuration example
Here is a an configuration example of a query to get the health score of all spine and leaf nodes:
  node_health:

    # The ACI class to query

    class_name: topSystem

    # Additional query parameters for the class query, must start with ? and be separated by &

    query_parameter: "?rsp-subtree-include=health,required"

    metrics:

      # The name of the metrics without prefix and unit

      - name: node_health

        # The key in the response to be used as metrics value

        value_name: topSystem.children.0.healthInst.attributes.cur

        # Type of metrics

        type: "gauge"

        # The help text

        help: "Returns the health score of a fabric node"

        # Unit of the metrics vaalue

        unit: "ratio"

        # Recalculate the metrics value. The expression support simple math expressions - https://github.com/Knetic/govaluate

        # The name must be value.

        # This example recalculate percentage like 90 to 0.9

        value_calculation: "value / 100"

    # Define the labels to add to the metric

    labels:

      - property_name: topSystem.attributes.dn

        regex: "^topology/pod-(?P<podid>[1-9][0-9]*)/node-(?P<nodeid>[1-9][0-9]*)/sys"

      - property_name: topSystem.attributes.state

        regex: "^(?P<state>.*)"

      - property_name: topSystem.attributes.oobMgmtAddr

        regex: "^(?P<oobMgmtAddr>.*)"

      - property_name: topSystem.attributes.name

        regex: "^(?P<nodename>.*)"

      - property_name: topSystem.attributes.role

        regex: "^(?P<role>.*)"
For more configuration options please checkout example-config.yaml
Using health scores we can get a better understanding of the impact of our services that utilize the fabric, instead of focusing on details like a single interface. In the end a faulty interface can be what we need to fix, but maybe not what we need to get a wake up call on in the middle of the night, especially since the fabric mesh is to its nature designed to be redundant.
With the aci-exporter the focus is on states and metrics we can access over the ACI APIC API’s. This does not mean that traditional SNMP based monitoring may not be needed, but from alerting on impact on our services the health score may be a better option to start with.
Always show some dashboards
Here are some examples of Grafana dashboards based on the metrics from the aci-exporter.
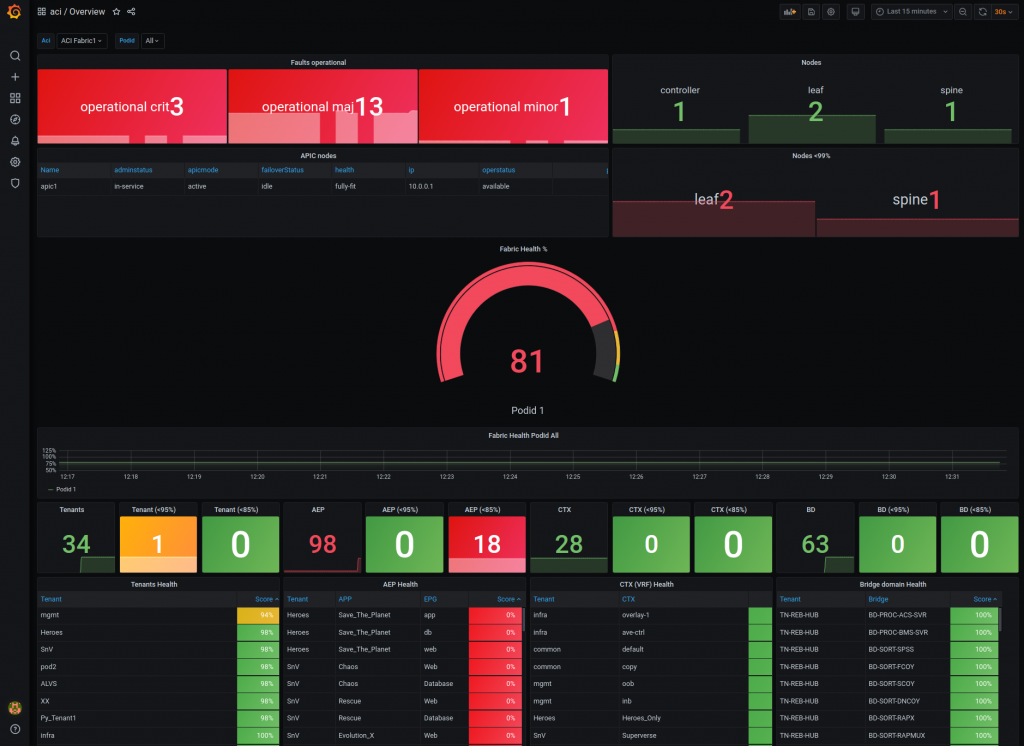
Overview of current state of the fabric and pod
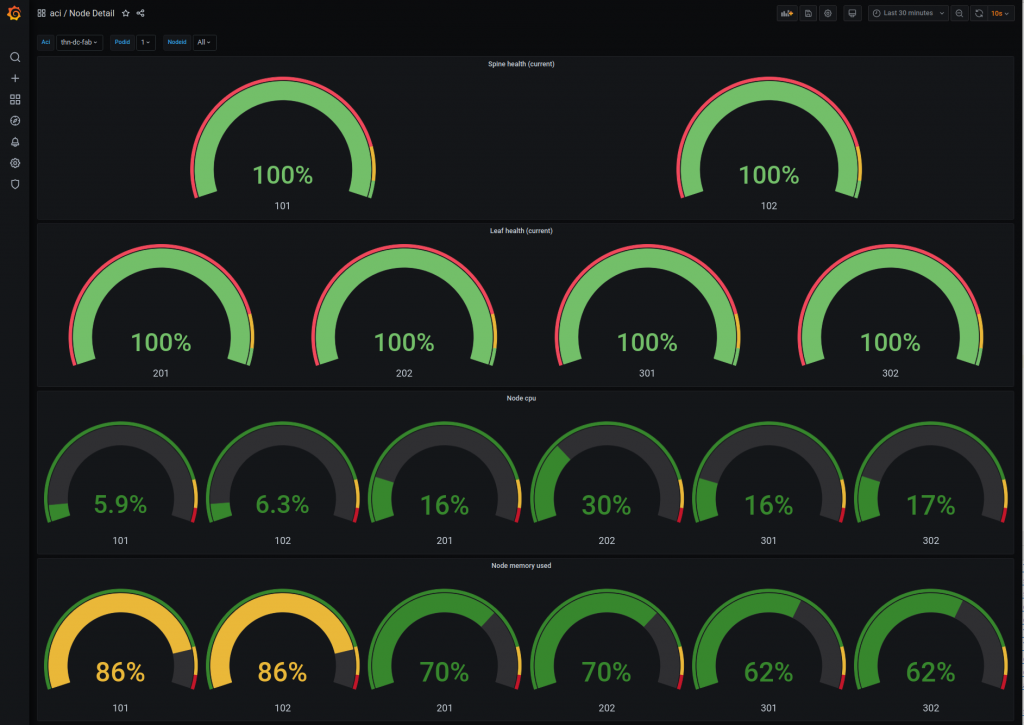
Node health with cpu and memory for each node
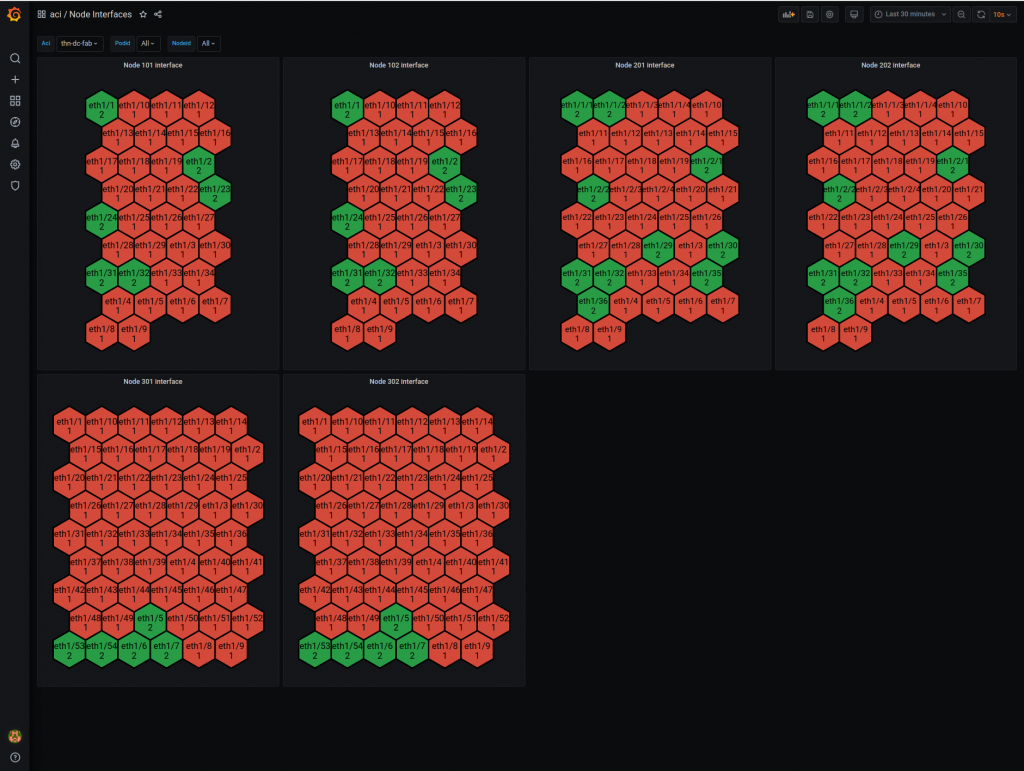
State by interfaces (green up and read down)
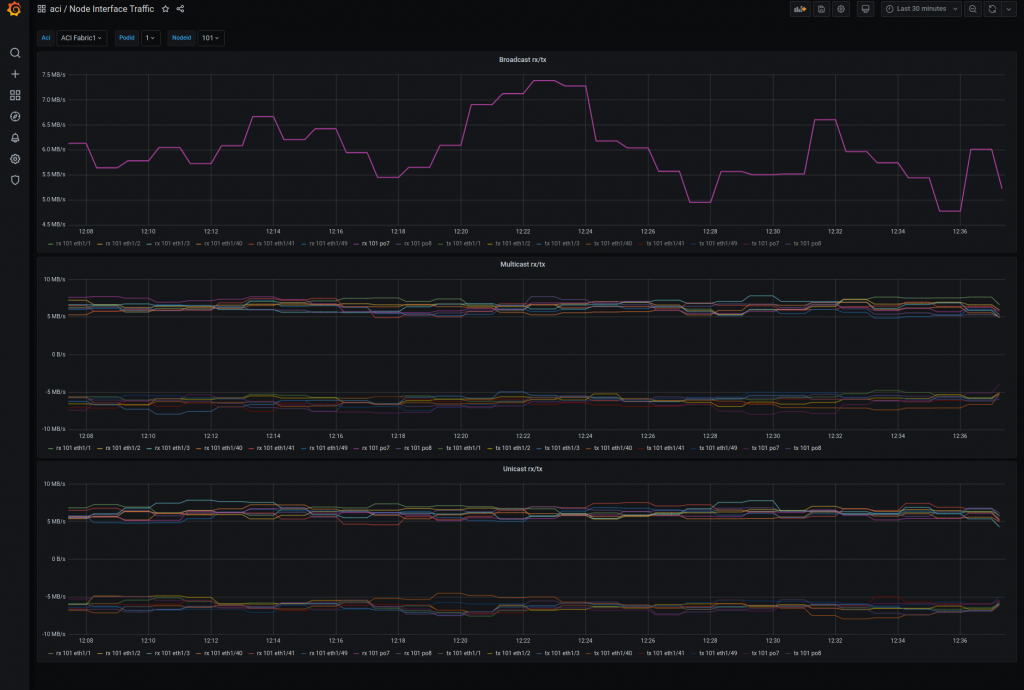
Traffic by interfaces
I hope there are some ACI users out there that can benefit from this solution, and your feedback is welcome.
Next time I will introduce a new project we are currently working on, how to use the ACI API subscription functionality. This will enable streaming of events from ACI over a websocket so they can be piped to log systems like Loki, Graylog and Elastic. The goal is of course to have metrics and events correlated in the same Grafana dashboards.
About the author