Martin Säfdal – Senior Consultant
Deep knowledge in Icinga, OP5 Monitor and the Elastic stack. Strong background in Windows, Linux, virtualization and storage. Martin is also an experienced Automation engineer with focus on Ansible.
Welcome to the first part of a mini blog post series that will show how you can use Prometheus together with Icinga 2.
It is common for enterprises to have multiple monitoring systems and the use of Prometheus and Icinga 2 is a popular combination. That is why we want to highlight Prometheus and Icinga 2. The popularity of Prometheus can in some degree be explained by the fact that some packaged Kubernetes solutions use Prometheus as their native monitoring solution, for example OpenShift from Red Hat.
However, Prometheus and Icinga 2 should not be viewed as an “either-or” proposition as these tools complement each other. When used together, it is possible to leverage both of their strengths.
The focus of this post is how metrics that are fetched by and stored in Prometheus can be presented in Icinga 2 and Icinga Web 2. While this post offers a detailed description on how to use Icinga 2 to execute Prometheus queries, the main concepts are also valid for other Nagios-based or Nagios-compatible monitoring solutions such as Nagios and ITRS OP5 Monitor.
The plugin check_prometheus_metric, a fork by magenta-aps based on check_prometheus_metric developed by Prometheus, will be used in this example. There are a multitude of plugins available and the concepts presented here will be valid for most plugins. It is also worth noting that the outlined solution works both with and without Icinga Director.
Download the plugin and place it in your plugin directory. Make sure to install any missing dependencies.
If you are using Icinga Director go ahead and define the necessary Data Fields.
Create a new command that uses the check_prometheus_metric plugin.
object CheckCommand "check_prometheus_metric" { import "plugin-check-command" command = [ PluginDir + "/custom/check_prometheus_metric.sh" ] arguments += { "-H" = { description = "URL of Prometheus host to query" required = false value = "$prom_server$" } "-c" = { description = "Critical level value (float or nagios-interval)" value = "$prom_critical$" } "-n" = { description = "A name for the metric being checked" value = "$prom_metric_name$" } "-p" = { description = "Add perfdata to check output" } "-q" = { description = "Prometheus query, that returns a float" value = "$prom_query$" } "-w" = { description = "Warning level value (float or nagios-interval)" value = "$prom_warning$" } } }
Create or modify a host template so that it includes the variable prom_node and set that variable to true.
Services will be assigned to hosts based on the custom variable on the host.
template Host "Prometheus node" { vars.prom_node = true }
Create a new service template.
It is possible to have generic services in Icinga 2 by assigning the hostname to the variable prom_instance_name. The variables prom_instance_name and prom_instance_port will be used in the query to get the correct metrics.
template Service "Prometheus query" { check_command = "check_prometheus_metric" vars.prom_instance_name = "$host.name$" vars.prom_instance_port = "9100" vars.prom_server = "prom:9090" }
Configure three services based on the newly created service template.
The services will be assigned to all hosts that have the prom_node host variable set to true.
apply Service "Prometheus up" { import "Prometheus query" vars.prom_warning = "1:" vars.prom_critical = "1:" vars.prom_metric_name = "up" vars.prom_query = "up{instance=\"$prom_instance_name$:$prom_instance_port$\"}" assign where host.vars.prom_node } apply Service "Prometheus load1" { import "Prometheus query" vars.prom_warning = "0:0.5" vars.prom_critical = "0:0.9" vars.prom_metric_name = "load1" vars.prom_query = "node_load1{instance=\"$prom_instance_name$:$prom_instance_port$\"}" assign where host.vars.prom_node } apply Service "Prometheus average network traffic received" { import "Prometheus query" vars.prom_warning = "1:1024" vars.prom_critical = "1:1024" vars.prom_metric_name = "network_receive_bytes" vars.prom_query = "rate(node_network_receive_bytes_total{device=\"eth0\",instance=\"$prom_instance_name$:$prom_instance_port$\"}[1m])" assign where host.vars.prom_node }
The three services have different queries and different thresholds configured to exemplify that it is possible to use both basic and more complex queries.
An example of a more complex query is used in the service Prometheus average network traffic received which checks the “average network traffic received, per second, over the last minute (in bytes)”. Reference: https://prometheus.io/docs/guides/node-exporter/
The services have been applied to the host node-exporter which has the prom_node custom variable set to true.
Services list
Service details
The actual command that is executed can be seen below. Note that the variable prom_instance_name has been populated with the hostname, node-exporter, and is used in the PromQL query.
In the next blog post, we’ll be covering how to store metrics from Icinga 2 in Prometheus.
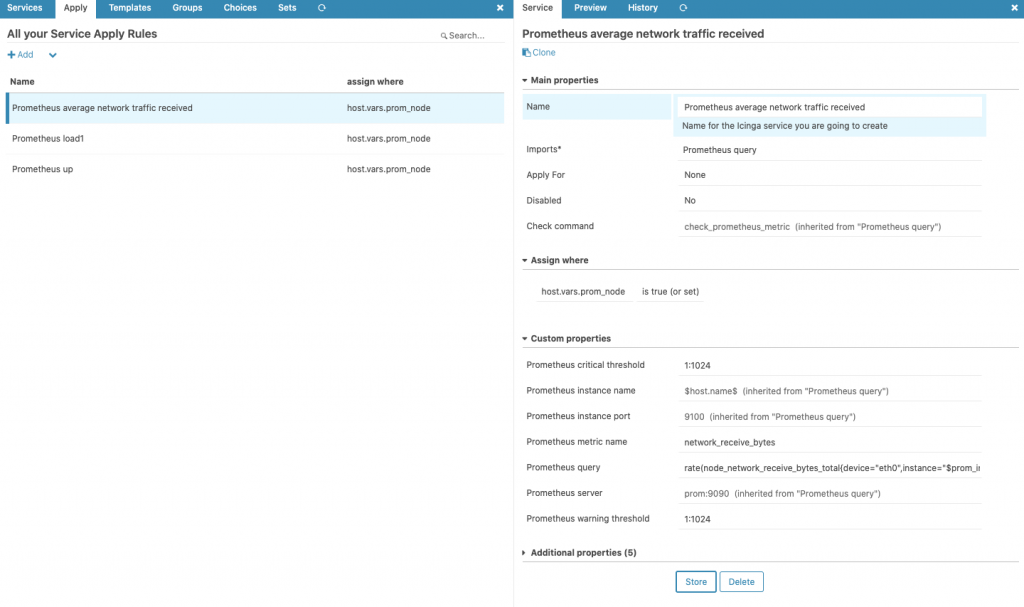
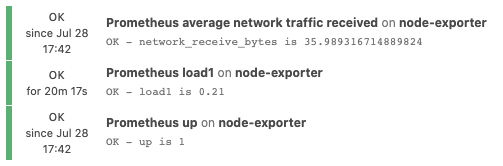
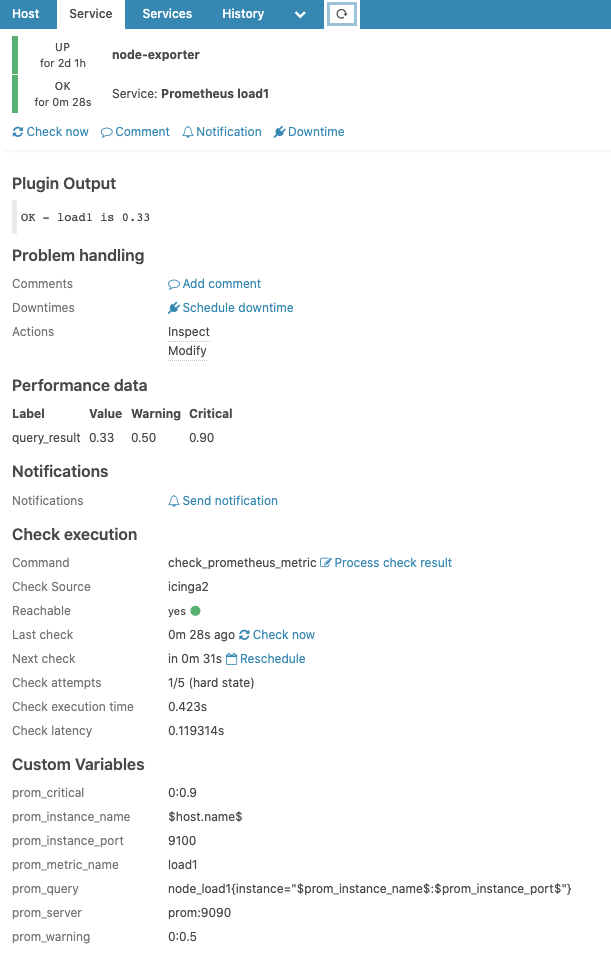
Should you need any assistance setting up Prometheus or Icinga 2, please contact us to know more.
Follow us on LinkedIn and github.
Martin Säfdal – Senior Consultant
Deep knowledge in Icinga, OP5 Monitor and the Elastic stack. Strong background in Windows, Linux, virtualization and storage. Martin is also an experienced Automation engineer with focus on Ansible.
Necessary cookies are absolutely essential for the website to function properly. This category only includes cookies that ensures basic functionalities and security features of the website. These cookies do not store any personal information.
Any cookies that may not be particularly necessary for the website to function and is used specifically to collect user personal data via analytics, ads, other embedded contents are termed as non-necessary cookies. It is mandatory to procure user consent prior to running these cookies on your website.