
Martin Säfdal – Senior Consultant
Deep knowledge in Icinga, OP5 Monitor and the Elastic stack. Strong background in Windows, Linux, virtualization and storage. Martin is also an experienced Automation engineer with focus on Ansible.
Welcome to the second part of a mini blog post series that will show how you can use Prometheus together with Icinga 2.
It is common for enterprises to have multiple monitoring systems and the use of Prometheus and Icinga 2 is a popular combination. That is why we want to highlight Prometheus and Icinga 2. The popularity of Prometheus can in some degree be explained by the fact that some packaged Kubernetes solutions use Prometheus as their native monitoring solution, for example OpenShift from Red Hat.
However, Prometheus and Icinga 2 should not be viewed as an “either-or” proposition as these tools complement each other. When used together, it is possible to leverage both of their strengths.
The focus of this post is how to export metrics from Icinga 2 and store them in Prometheus.
Storing metrics in Prometheus can be achieved by using two tools developed by us at Opsdis, monitor-promdiscovery and icinga2-exporter.
monitor-promdiscovery dynamically discovers hosts in Icinga 2 and the information is then used as a file-based service discovery by Prometheus. Host groups in Icinga 2 are used to limit which hosts you want Prometheus to scrape metrics for.
icinga2-exporter exposes performance data as Prometheus formatted metrics. Prometheus scrapes metrics exposed by icinga2-exporter for hosts discovered with monitor-promdiscovery.
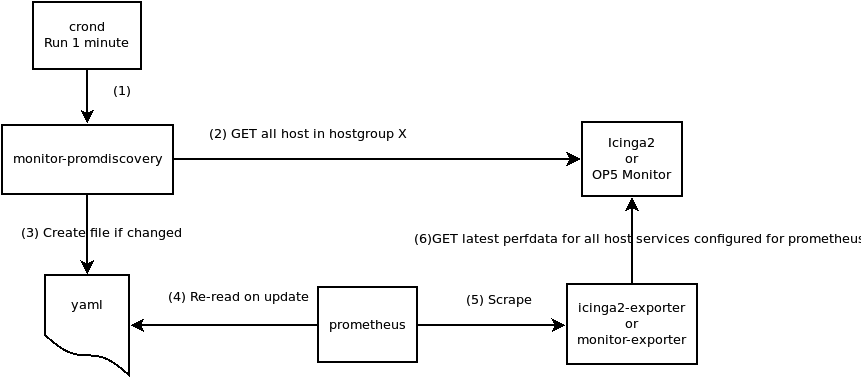
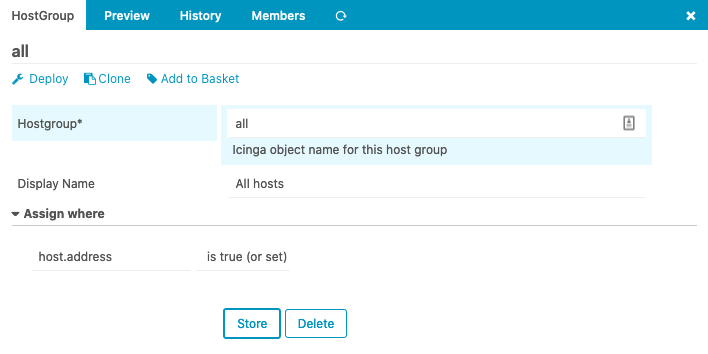
monitor-promdiscovery uses host groups to limit which hosts to export as Prometheus targets.
Create a new host group or use one or more existing host groups.
object HostGroup "all" {
    display_name = "All hosts"
    assign where host.address
}
Both monitor-promdiscovery and icinga2-exporter use the Icinga 2 API to get their information.
Create a new API user or use an existing user.
Edit /etc/icinga2/conf.d/api-users.conf to add a new API user.
object ApiUser "api-user" {
    password = "secretpassword"
    permissions = [ "objects/query/Host", "objects/query/Service" ]
}
Follow the instructions on how to install icinga2-exporter.
Configure icinga2-exporter by editing config.yml.
Specify the URL to the Icinga 2 API as well as the username and password for the API user.
# Port can be overridden by using -p if running development flask
# port: 9638

icinga2:
  # The url to the Icinga 2 server
  url: https://icinga2:5665
  user: api-user
  passwd: secretpassword
  # All prometheus metrics will be prefixed with this string
  metric_prefix: icinga2
  # Example of host custom variables that should be added as labels and how to be translated
  host_custom_vars:
    # Specify which custom_vars to extract from hosts in icinga2
    - env:
        # Name of the label in Prometheus
        label_name: environment
    - site:
        label_name: dc

  # This section enable that for specific check commands the perfdata metrics name will not be part of the
  # prometheus metrics name, instead moved to a label
  # E.g for the disk command the perfdata name will be set to the label disk like:
  # icinga2_disk_bytes{hostname="icinga2", service="disk", os="Docker", disk="/var/log/icinga2"}
  perfnametolabel:
      # The command name
      disk:
        # the label name to be used
        label_name: mount

logger:
  # Path and name for the log file. If not set send to stdout
  # logfile: /var/tmp/icinga2-exporter.log
  # Log level
  level: INFO
Follow the instructions on how to run icinga2-exporter.
Follow the instructions on how to install monitor-promdiscovery.
Configure monitor-promdiscovery by editing config.yml.
Specify the URL to the Icinga 2 API as well as the username and password for the API user.
Define the host group(s) that will be used to select hosts to become Prometheus targets.
# The system property must be set to the same name as the definition if used
# if not set it must be set with the switch -s
system: icinga2

icinga2:
  # The url to the Icinga 2 server
  url: https://icinga2:5665
  user: api-user
  passwd: secretpassword
  # The hostgroup used to select hosts as targets
  hostgroup:
    - all
  prometheus:
    # path where to create the file-based discovery file
    sd_file: /etc/prometheus/sd/icinga2_sd.yml
    # Additional labels to tag metrics with
    labels:
      source: icinga2
      env: prod

logger:
  # Path and name for the log file. If not set sent to stdout
  # logfile: monitor-promdiscovery.log
  # Format if day will have current day as post fix
  # format: day
  # Log level
  level: INFO
Follow the instructions on how to run monitor-promdiscovery.
Sample output of icinga2_sd.yml.
- labels:
    env: prod
    source: icinga2
  targets:
  - icinga2
  - node-exporter
Install Prometheus or use an existing Prometheus instance.
Add a new job to the prometheus.yml configuration file under the section scrape_configs.
Configure the new job to use the icinga2_sd.yml file created by monitor-promdiscovery and point the scraping to the icinga2-exporter.
[...]

scrape_configs:
  - job_name: 'icinga2'
    scrape_interval: 2m
    metrics_path: /metrics
    file_sd_configs:
    - files:
      - '/etc/prometheus/sd/icinga2_sd.yml'
    relabel_configs:
      - source_labels: [__address__]
        target_label: __param_target
      - source_labels: [__param_target]
        target_label: instance
      - target_label: __address__
        # The address for the icinga2-exporter
        replacement: icinga2-exporter:9638
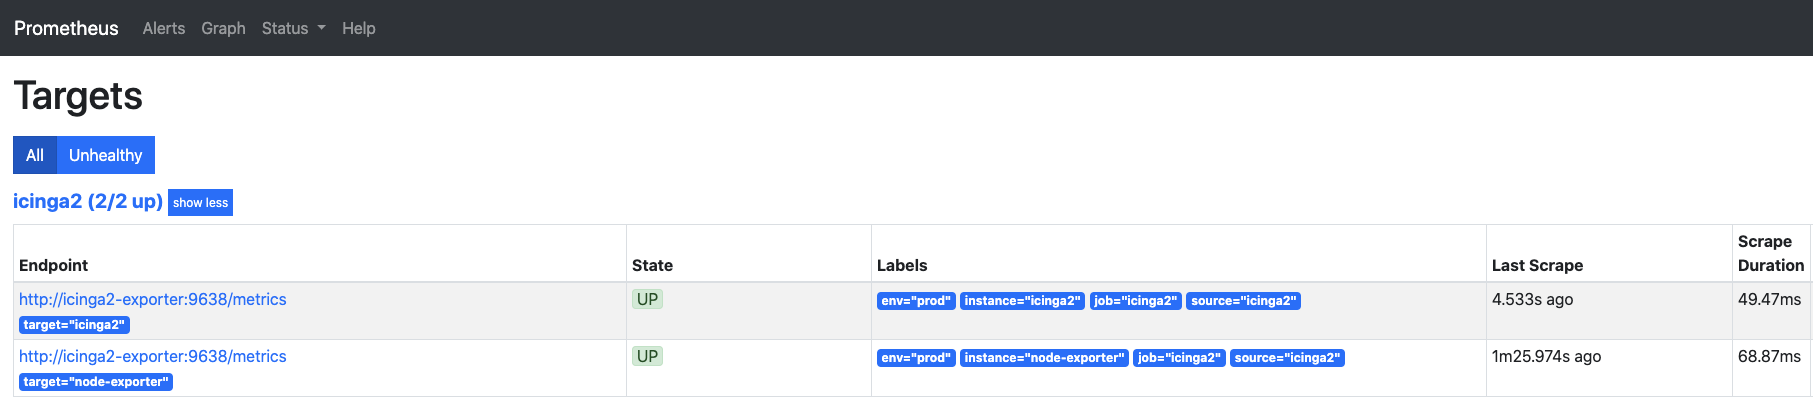
Targets from the file-based service discovery created by monitor-promdiscovery viewed in Prometheus.
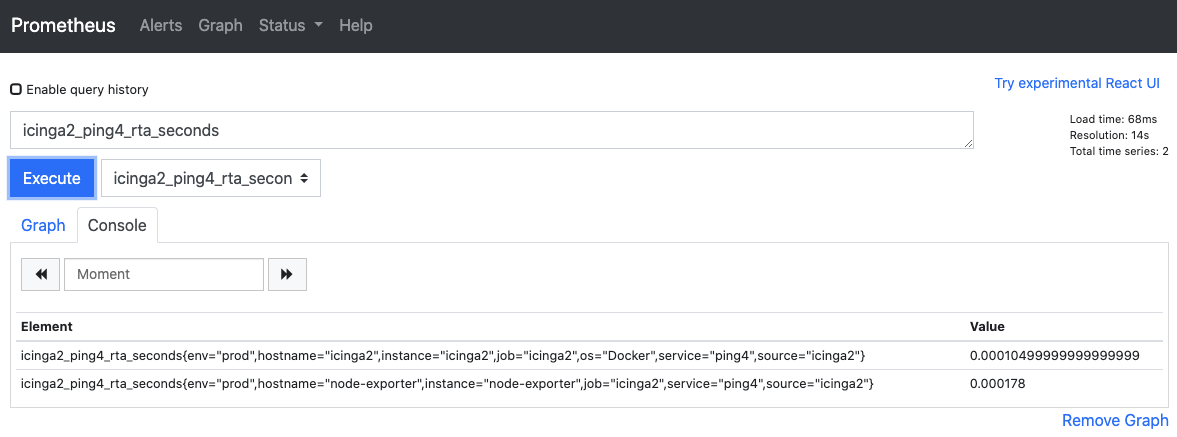
Performance data from Icinga 2 exposed by icinga2-exporter and scraped by Prometheus.
In the next blog post, we’ll be covering how to embed Grafana graphs in Icinga Web 2 by using Prometheus as the data source.
Should you need any assistance setting up Prometheus or Icinga 2, please contact us to know more.
Are you wondering which other technologies we work with, have a look here.
Don’t forget to follow us on LinkedIn and github.

Martin Säfdal – Senior Consultant
Deep knowledge in Icinga, OP5 Monitor and the Elastic stack. Strong background in Windows, Linux, virtualization and storage. Martin is also an experienced Automation engineer with focus on Ansible.